接上一篇 Angular - Consume OData Services 从 SAP OData Service 取数后, 我们打算使用 ECharts 对数据进行展示. 本篇代码 Github.
Step 1. Install Dependencies
添加需要用到的 NPM 依赖包
npm install echarts -S
npm install ngx-echarts -S
npm install @types/echarts -D
echarts是 ECharts 库的主程序包ngx-echarts封装了一下 ECharts 变成了一个 Angular Directive@types/echarts是echarts对应的 TypeScript 类型说明
Step 2. Import Module
在主 Module 中引入封装好的 NgModule NgxEchartsModule
import { NgxEchartsModule } from 'ngx-echarts';

@NgModule({
  imports: [
    ...,
    NgxEchartsModule
  ],
})
export class AppModule { }
Step 3. EChart Component
新建一个 Component 来封装我们要画的图形
ng g component product-chart
在新建的 Component 页面文件中添加如下代码
<select id="theme-select" [(ngModel)]="theme">
    <option value="">--Please choose an theme--</option>
    <option value="vintage">vintage</option>
    <option value="dark">dark</option>
    <option value="macarons">macarons</option>
    <option value="infographic">infographic</option>
    <option value="shine">shine</option>
    <option value="roma">roma</option>
</select>
<button (click)="more($event)">Add</button>
<div echarts [options]="options" [initOpts]="initOpts" [theme]="theme" (chartInit)="onChartInit($event)" class="demo-chart"></div>
- button 的
more方法会往图形中添加更多数据 - div
echarts主要是这个 Directive 作为整个 ECharts 程序的入口, 它会在页面上创建一个 Container 作为此图形的画布 options属性对应 ECharts 的options, 它会设置图形的各种属性initOpts会在最开始设置一些基本的图形 Container 属性, 如是用 canvas 还是 svg 技术来绘制图形, 还可以设置画布大小theme主题属性可以设置此图形的主题chartInit此事件可以获得 ECharts 对象, 便于针对它进行更多操作
再来看一下 TS 代码怎么写
import { Component, OnInit } from '@angular/core';
import { ProductService } from '../products/product.service';

@Component({
  selector: 'app-product-chart',
  templateUrl: './product-chart.component.html',
  styleUrls: ['./product-chart.component.css'],
  providers: [ ProductService ]
})
export class ProductChartComponent implements OnInit {
  echartsInstance: any;
  theme: string = undefined;
  options = {
    title: {
      text: 'Products Pie',
      left: 'center',
      top: 20,
      textStyle: {
        color: '#ccc'
      }
    },
    tooltip: {
      trigger: 'item',
      formatter: '{a} <br/>{b} : {c} ({d}%)'
    },
    series: [
      {
        name: 'Counters',
        type: 'pie',
        radius: ['10%', '50%'],
        data: [],
        roseType: 'area',
        animationType: 'scale',
        animationEasing: 'elasticOut',
        animationDelay: function (idx) {
          return Math.random() * 200;
        }
      }
    ]
  };

  initOpts = {
    height: 600
  };

  constructor(private productService: ProductService) {}

  ngOnInit() {
  }

  more(event) {
    this.productService.getProducts().subscribe(products=> {
      let data = products.map(product=> {
        return {
          value: product.Price,
          name: product.ProductName
        }
      });

      this.options.series[0].data.push(...data);

      this.echartsInstance.setOption(this.options);
    });
  }

  onChartInit(e: any) {
    this.echartsInstance = e;
    console.log('on chart init:', e);
  }
}
关于 ECharts 的 options 怎么设置我们这里不展开讲. 主要看一下 more 方法里如何调用 OData Service 获取 SAP 系统数据.
this.productService.getProducts()是调用ProductService会获取 Products 数据products.map()会将 OData 数据转换成 ECharts 需要的数据类型this.options.series[0].data.push(...data)把数据添加到选项中this.echartsInstance.setOption(this.options)使用setOption方法可以重新绘制图形theme是主题字段, 可以通过页面中的select[(ngModel)]="theme"选择不同的主题
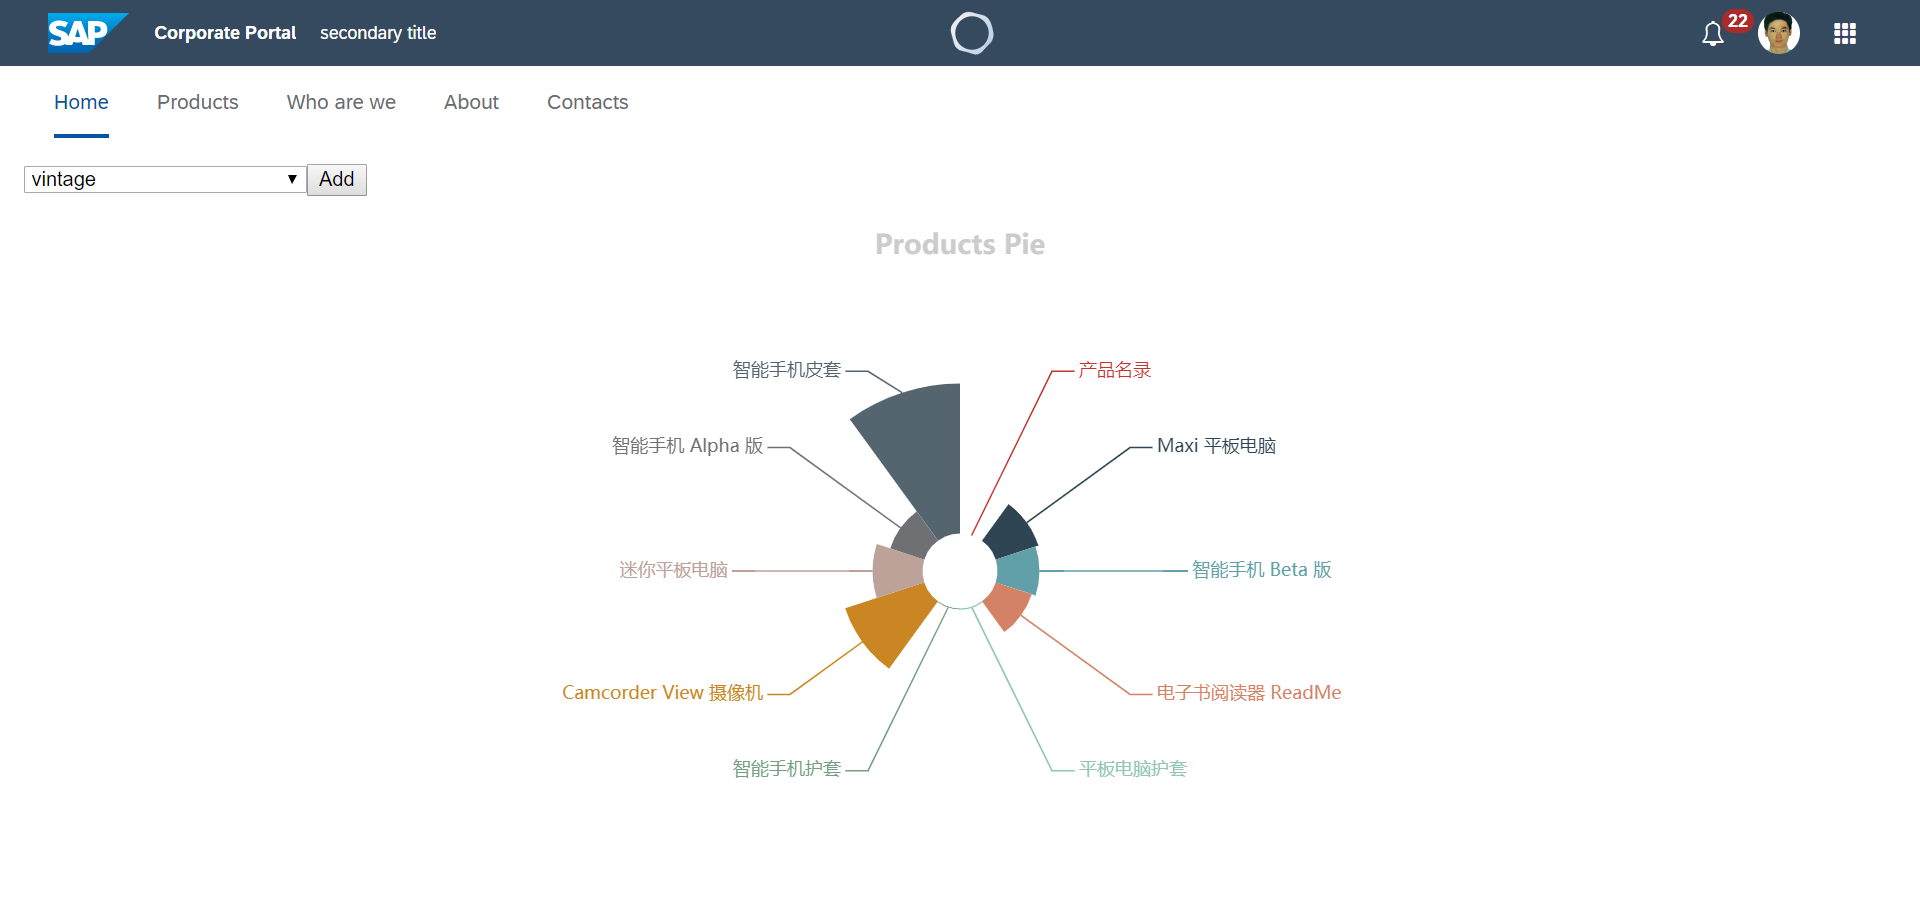
页面效果如下图
Comments